

Earnings after tax surged by 59.0 percent Year-on-year to $32.7 million, largely due to a $13.3 million tax credit that masked significant weakness in core operating performance in the review period.
Revenue contracted by 11.7percent Year-on-year to $159.5 million, dragged by a 16.5percent Year-on-year decline in oil revenue which concealed the impact of price-induced increase in gas revenue (+5.6 percent Year-on-year).
We attribute the weakness in oil revenue to a 19.9percent Year-on-year decline in oil production to 21,885 barrels of oil per day (bopd) and a 6.2percent Year-on-year moderation in realised crude price to $61.7/bbl. In our view, the decline in oil production may be slightly connected to Nigeria’s compliance to the OPEC production cut deal, which, according to the Minister of State for Petroleum, was kick-started in February 2019.
We also believe that oil price is yet to fully recover from the impact of the supply glut that saw crude oil price crash by 38.0percent to $52.2/bbl between October and December 2018. This lack of full recovery likely explains the lower realised oil price reported in Seplat’s Q1 2019 numbers. Going forward, management is optimistic that on-going capital expenditure (Capex) on drilling, which was ramped up in H2’18, would have a positive impact on crude volumes and revenue in the second half of 2019.
Therefore, the company retains FY’19 guidance of $200 million in capex, between 24,000 to 27,000 bopd in liquid production, and 146 to 164 Million standard cubic feet per day in gas production
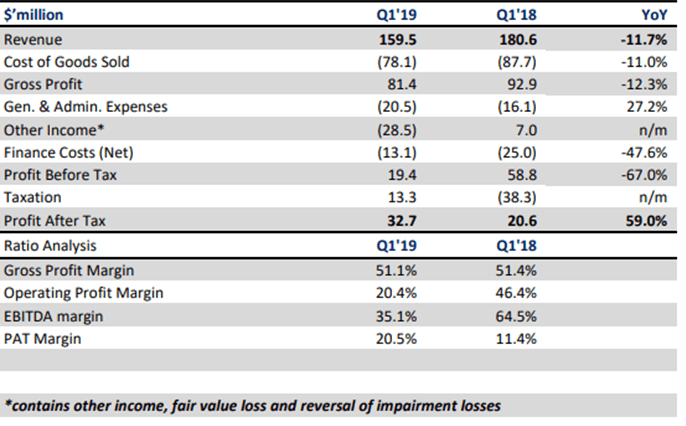
EBITDA margin plunged to 35.1 percent in Q1’19 from 64.5 percent in Q1’18, predominantly due to $15.8 million overlift revaluation loss (vs. $8.6 million underlift revaluation gain in Q1’18), $7.0 million unrealized loss on derivatives (vs. nil in Q1’18), and $5.2 million cost of hedging (vs. $1.2 million).
The overlift revaluation loss mirrored the change in the market value of the shortfall between crude oil lifted and crude oil sold during the period. We also recall that SEPLAT entered into crude price hedge contracts at an average premium price of $1.3/bbl on 4 million barrels in December 2018, which remained unexecuted at strike price of $50/bbl to $55/bbl.
The cost of this contract also weighed on EBITDA margin. Excluding the overlift revaluation and fair value losses, EBITDA margin would have declined by only 4.3 1percentage points (ppts) Year-on-year. Notwithstanding, the combination of lower net finance cost (-47.6percent Year-on-year) and a $13.3 million tax credit (vs. tax charge of $38.3 million in Q1’18) bolstered PAT margin in first quarter of 2019 (+9.1ppts Year-on-year to 20.5percent)
Free Cash Flow to Equity (FCFE) surged to $63.3 million in Q1’19 from $474.0 thousand in first quarter of 2018. The increase in Free cash flow to equity (FCFE) reflected gains from the application of Seplat’s huge capital allowance and improved working capital management. We note that Seplat’s huge capital allowance is typically used to offset tax charges—implying no significant passthrough to cash balance.
Seplat’s strong working capital position is mostly evidenced by its negative cash conversion cycle in Q1‘19, which suggests that it likely generates revenue before it pays suppliers. This pattern is likely to subsist in coming quarters.
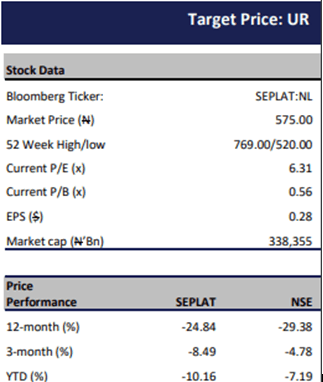
Seplat trades at a full year 19 estimate EV/EBITDA of 1.6x relative to its five-year average of 4.3x and MEA peer average of 5.5x. The stock also has an EV/2P ratio of 1.4x, which compares favourably to 2.1x for selected peers.

Join BusinessDay whatsapp Channel, to stay up to date
Open In Whatsapp